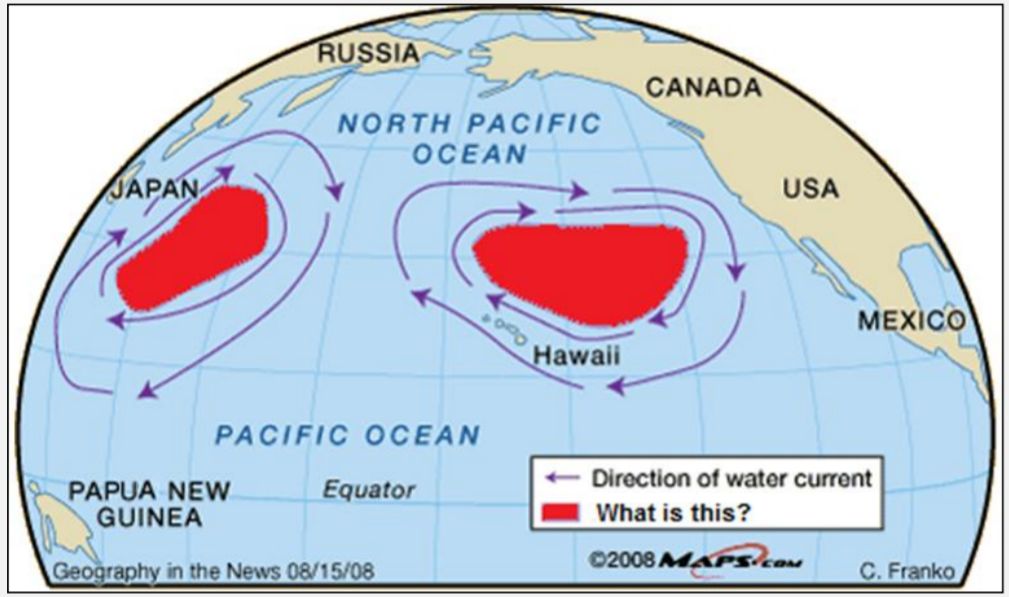
問題詳情
What do the red areas in the map represent?
(A) zones of high levels of chlorophyll concentration
(B) the estimated coverage of the Great Pacific garbage patch
(C) zones of low mean annual sea surface temperature
(D) feeding grounds of several whale species