問題詳情
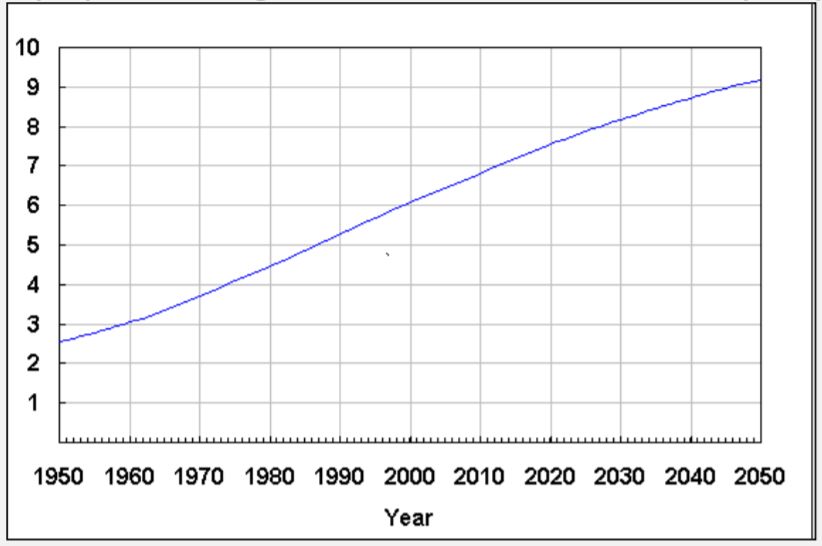
This time-series graph shows the projection of:
(A) business development plans for 15 members of theEuropean Union (1014 €)
(B) iron ore mining growth (thousand tons per year)
(C) petrol price in world market (USD per litre)
(D) world population growth (thousand million people)