問題詳情
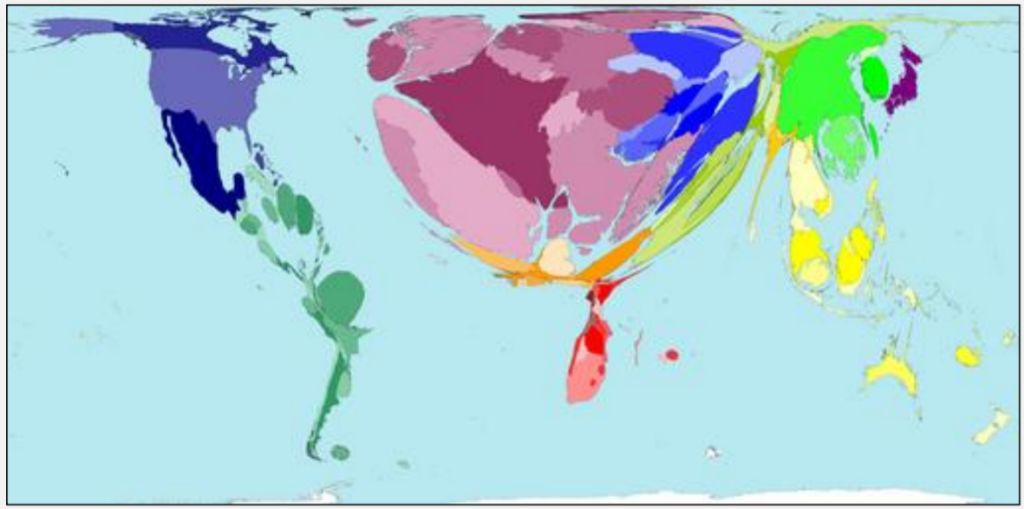
What does this map represent?
(A) cereals exports
(B) carbon dioxide emissions
(C) total population
(D) international tourists arrivals
What does this map represent?
(A) cereals exports
(B) carbon dioxide emissions
(C) total population
(D) international tourists arrivals