問題詳情
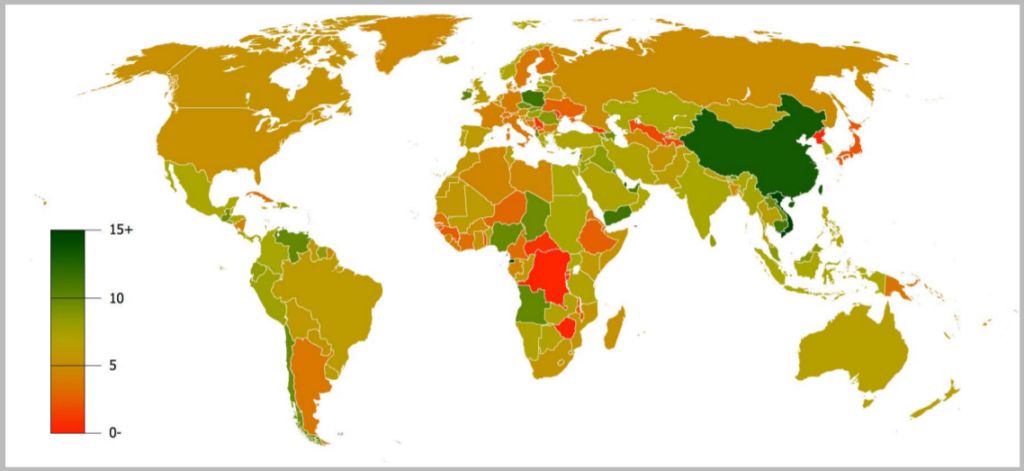
26. This map shows the data by country for:
(A)GDP growth 1990–2007
(B)GDP per capita in 2009
(C)employment in agriculture in 2009
(D)population density in 2009
26. This map shows the data by country for:
(A)GDP growth 1990–2007
(B)GDP per capita in 2009
(C)employment in agriculture in 2009
(D)population density in 2009