問題詳情
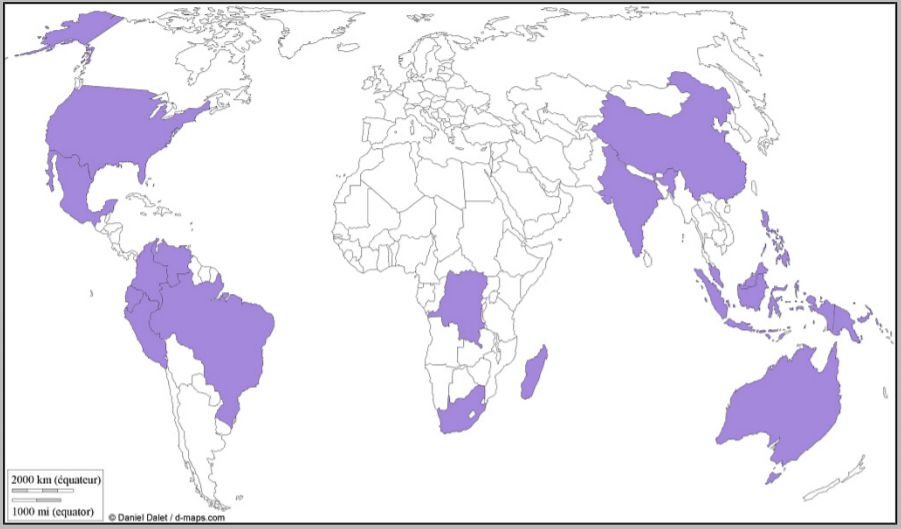
10. The distribution shown on the map is of countries with:
(A)high levels of biodiversity
(C)high levels of coal production
(B)low levels of urbanisation
(D)low levels of water stress
10. The distribution shown on the map is of countries with:
(A)high levels of biodiversity
(C)high levels of coal production
(B)low levels of urbanisation
(D)low levels of water stress