問題詳情
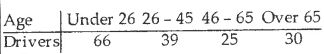
5.A random sample of 160 car accidents are selected and categorized by the age of the driver determined to be at fault. Theresults are listed below. The age distribution of drivers for the given categories is 18% for the under 26 group, 39% for the26~45 group, 31% for the 45-65 group, and 12% for the group over 65. Calculate the chi-square test statistic X used to testthe claim that all ages have crash rates proportional to their driving rates.
(A) 75.101
(B) 85.123
(C) 95.431
(D) 101.324
參考答案
答案:[無官方正解]
難度:計算中-1
書單:沒有書單,新增
難度:計算中-1
書單:沒有書單,新增