問題詳情
3. The figure below shows the relationship between the titration curve and the acidbase properties of glycine. The key points in the titration are designated I to IV.Which key point of the figure where the average net charge of glycine is 0?
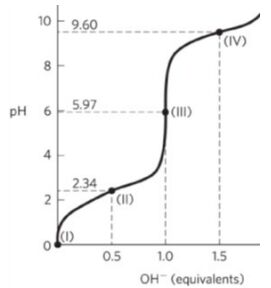
(A) I
(B) II
(C) III
(D) IV
參考答案
答案:[無官方正解]
難度:計算中-1
書單:沒有書單,新增
難度:計算中-1
書單:沒有書單,新增