問題詳情
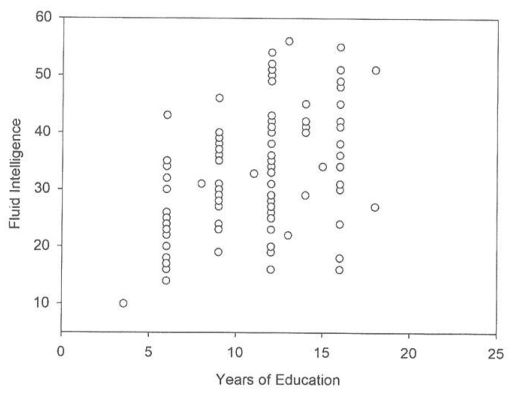
The next 5 questions (6 to 10) concern the following data. The scatter plot presented in next page shows howwell years of education predict the performance on a fluid intelligence test in 112 volunteers aged between 50 and81 years old.
【題組】6. The scatter plot shows
(A). a weak negative relationship between years of education and fluid intelligence
(B). a moderately strong negative relationship between years of education and fluid intelligence
(C), a weak positive relationship between years of education and fluid intelligence
(D), a moderately strong positive relationship between years of education and fluid intelligence
參考答案
答案:[無官方正解]
難度:計算中-1
書單:沒有書單,新增
難度:計算中-1
書單:沒有書單,新增