問題詳情
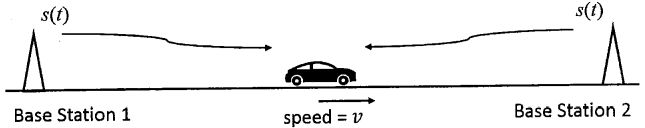
5. (Total=34%) The figure below depicts a scenario where two base stations transmit.simultaneously the same Quadrature Amplitude Modulation (QAM) signal to a carthat is in the middle of two base stations and moves toward Base Station 2. Thesignal is expressed as

in which f0 is the carrier frequency, p(t) is a rectangular pulse with the widthof T, and the amplitudes Ac and As can take on values from{±1, ±3}.
【題組】(a) (5%) Sketch the signal space diagram (constellation diagram) of this QAMsignal.